Optimizing C# code performance and paintball
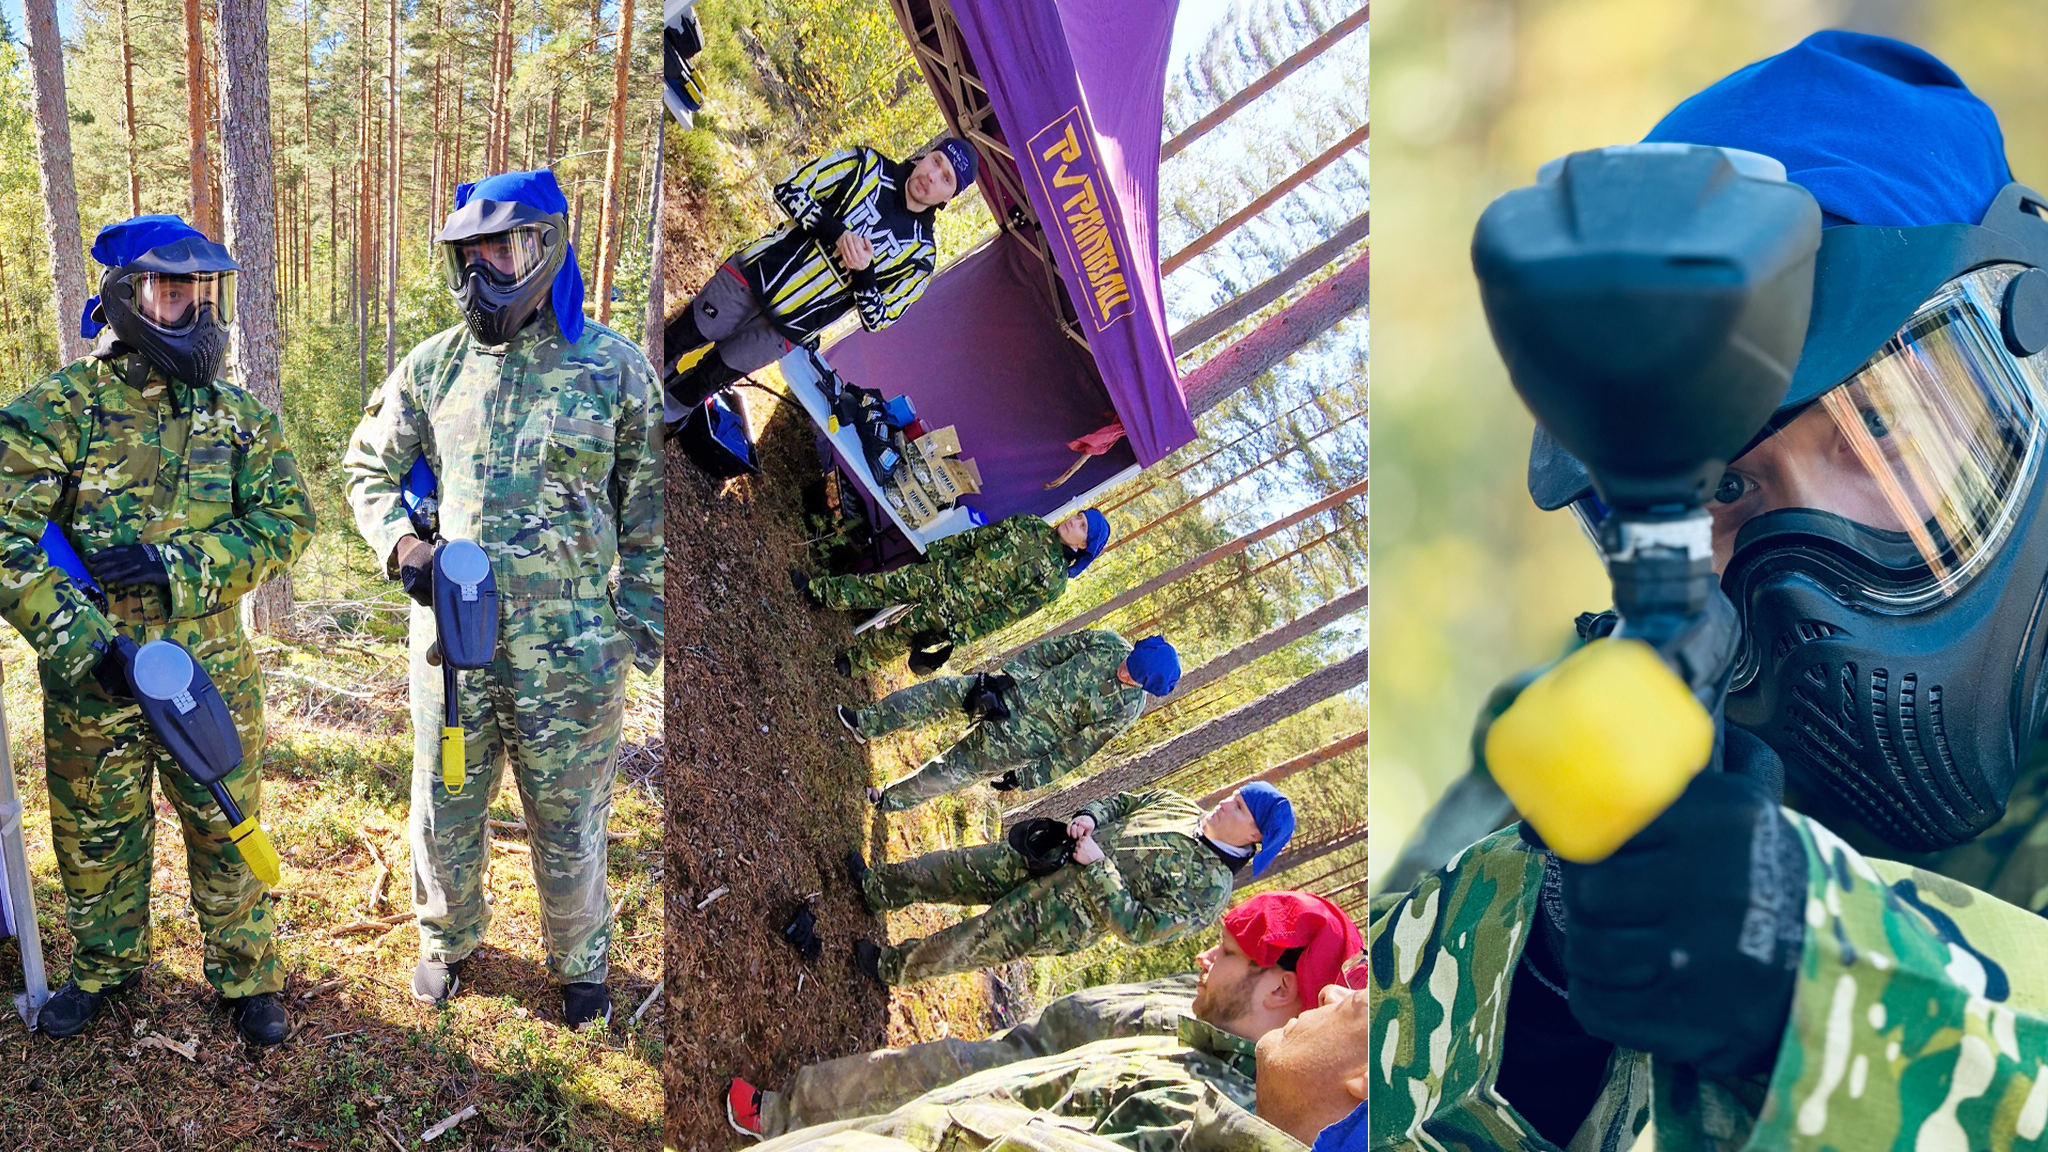
Our team of developers enjoys the flexibility of remote work, so it’s important for us to regularly come together for training and fun!
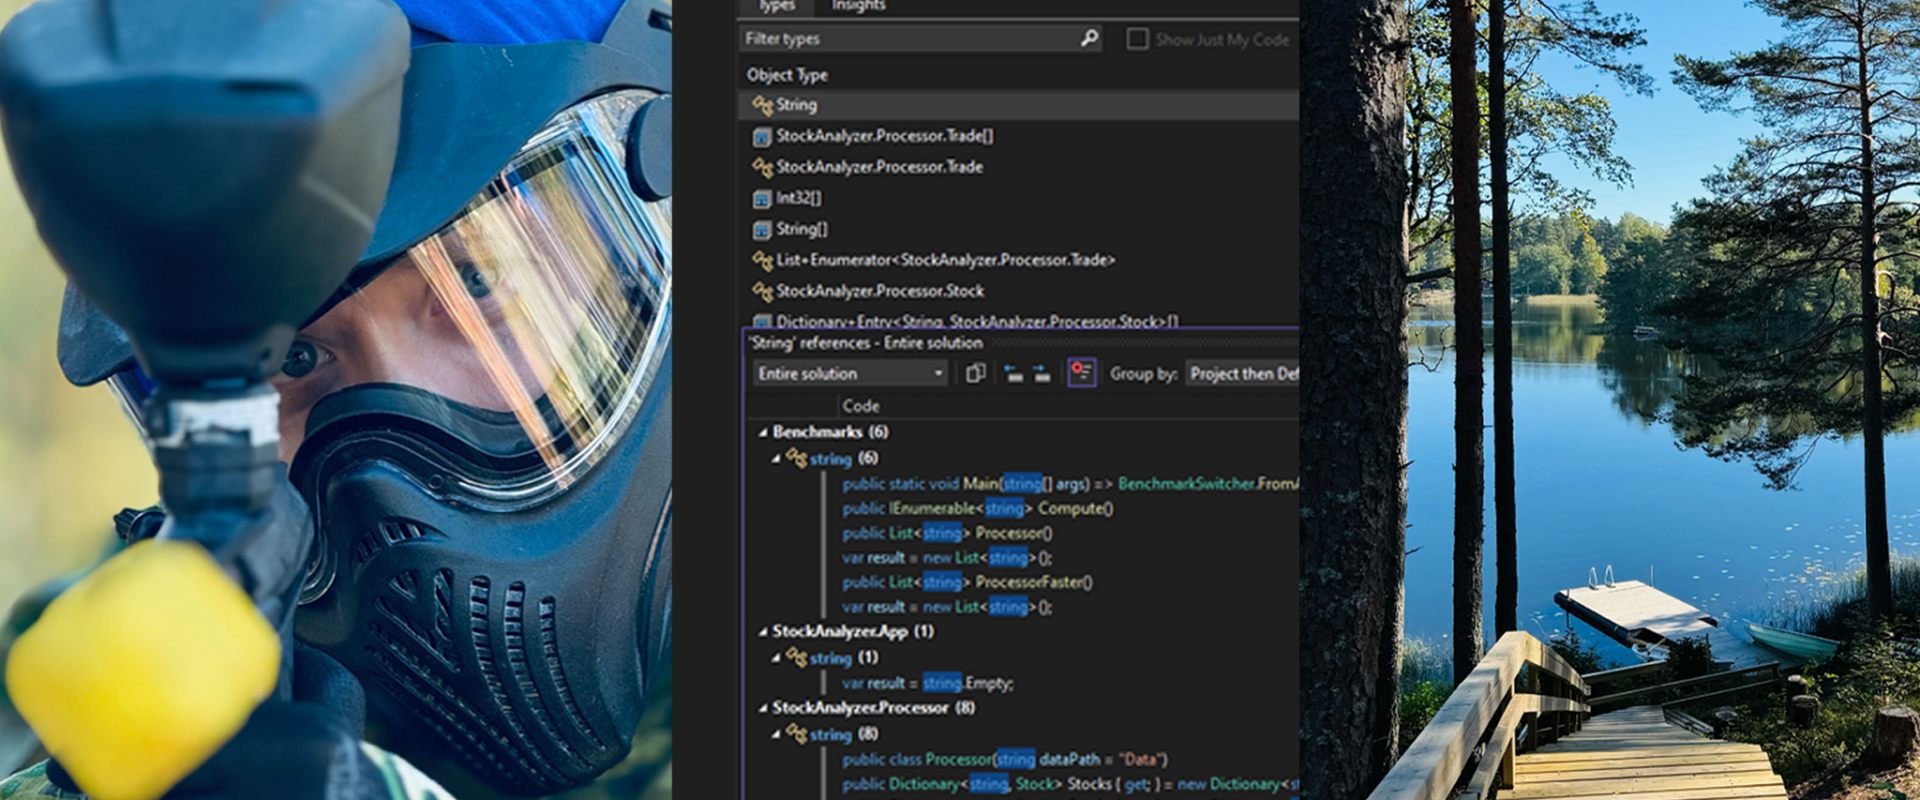
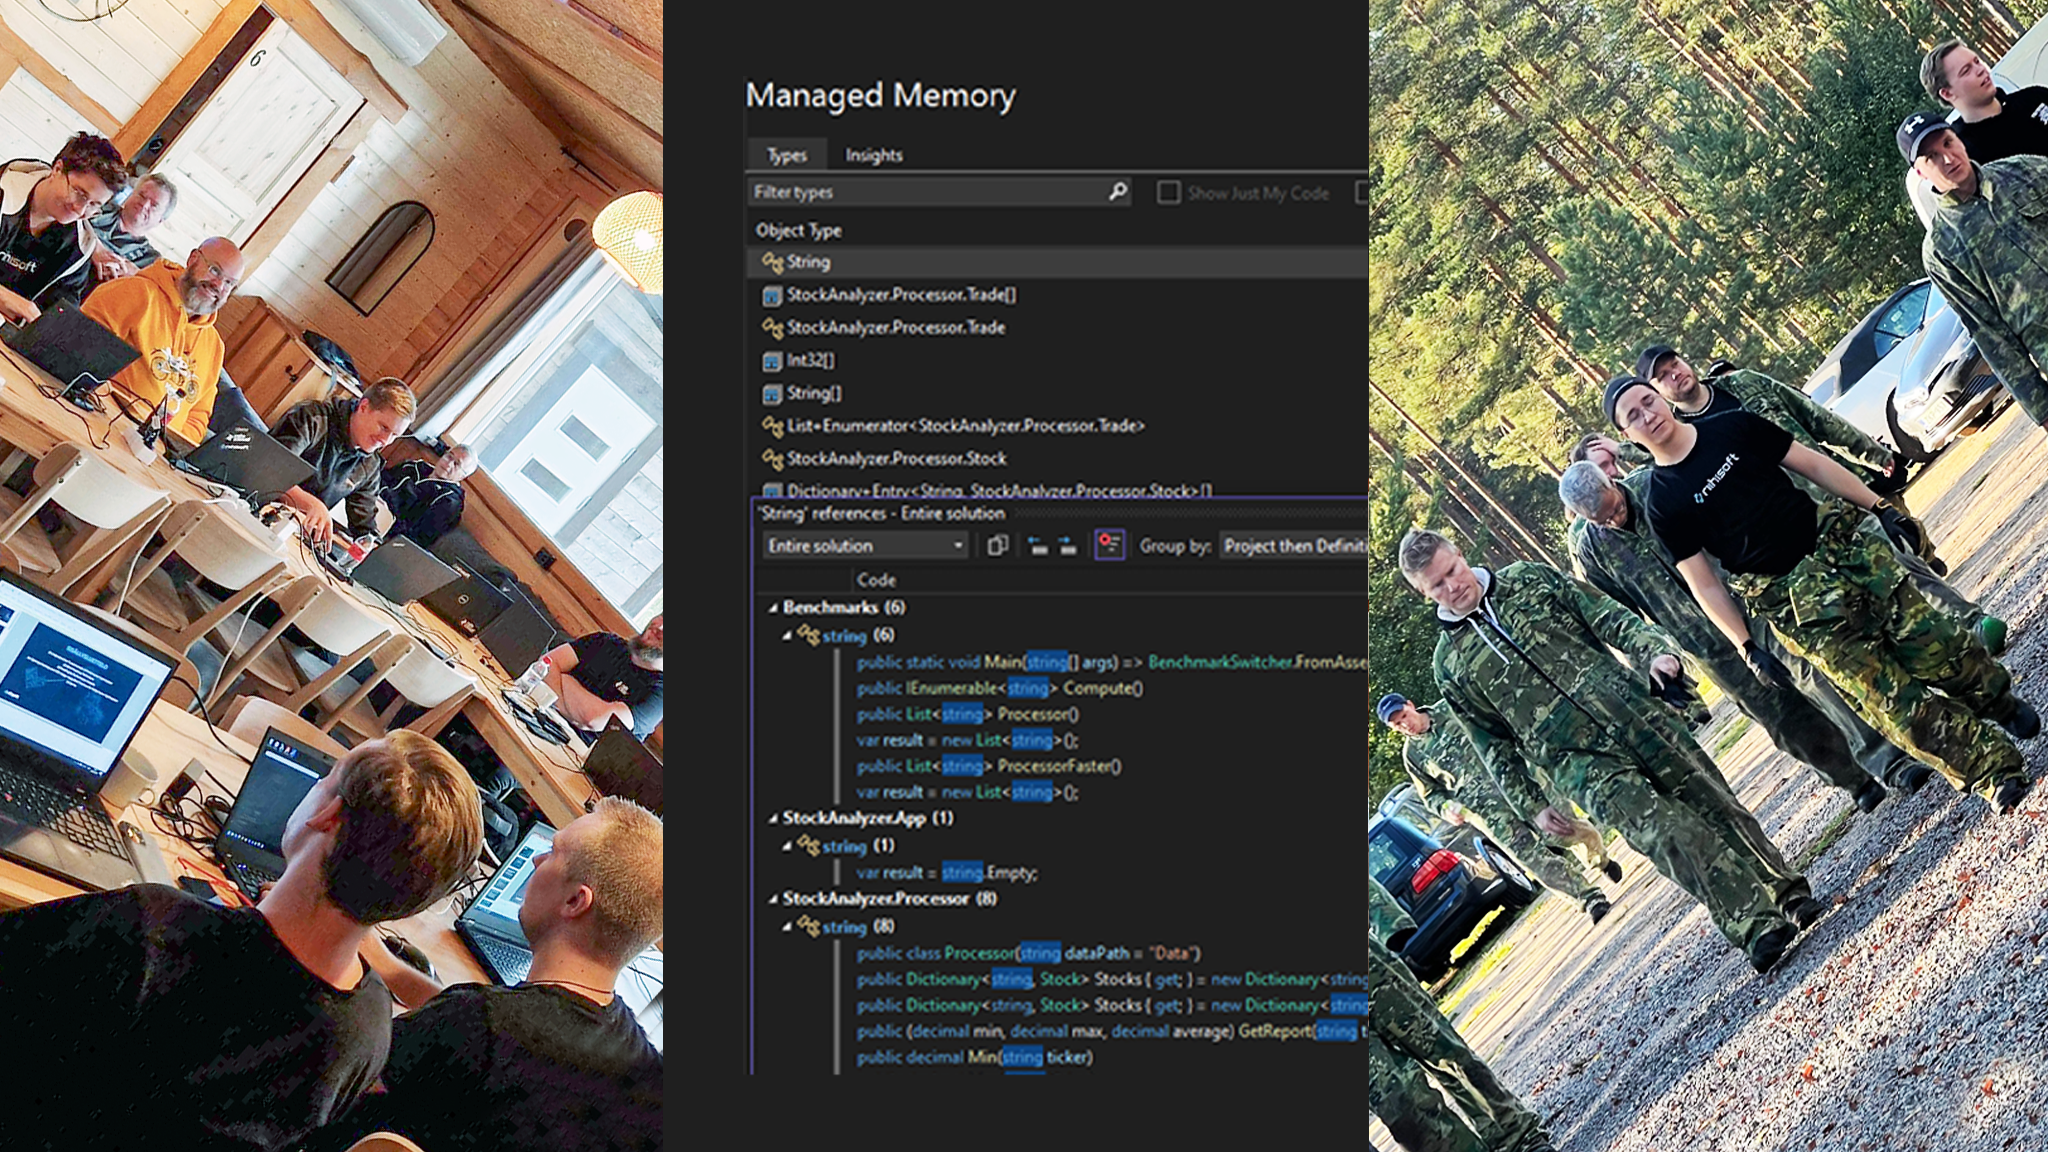
We kicked off the day with a hands-on workshop on C# performance optimization. We focused on benchmarking, running tests to evaluate and compare the performance of different implementations and configurations. Profiling helped us uncover bottlenecks in code execution, optimizing memory, CPU, and thread usage to enhance application performance, user experience, and scalability.
Our tools of choice:
– Visual Studio Profiler: Quick insights into performance and resource consumption right from our development environment
– JetBrains dotTrace: Advanced, detailed reporting for tackling complex performance challenges
– Microsoft PerfView: Perfect for profiling larger, more complex applications’ performance and memory use
The day ended with an epic paintball showdown and some much-needed relaxation in the sauna at Lopen Luksus.